SPECIFICATION
SUMMARY
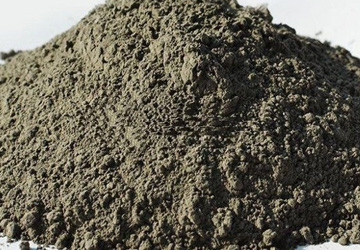
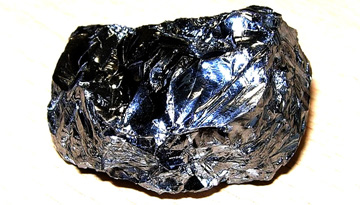
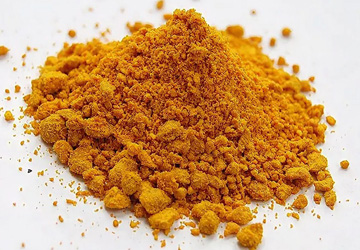
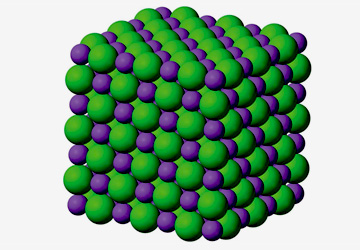
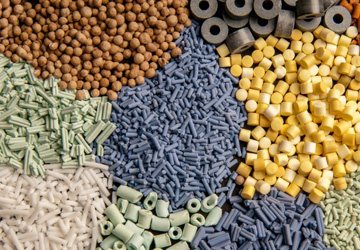
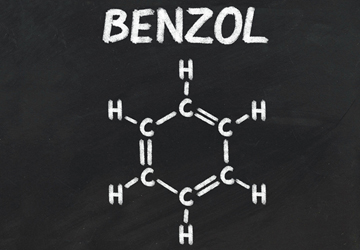
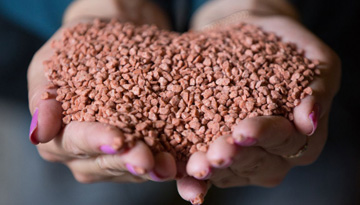
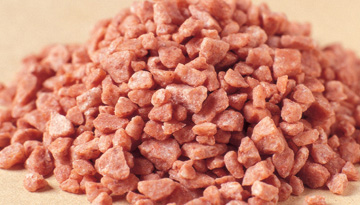
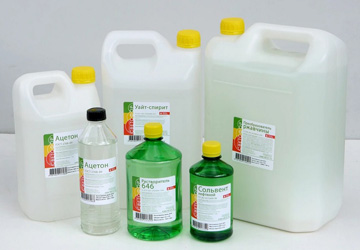
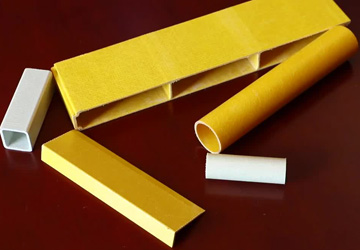
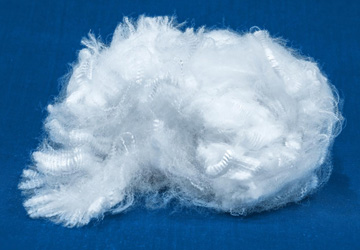
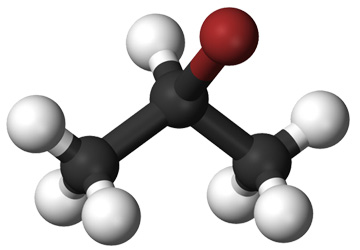
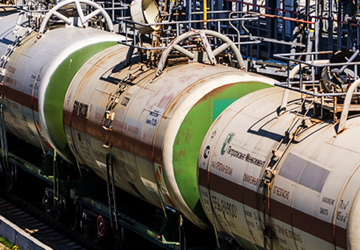
GENERAL PRODUCT INFORMATION
ANALYSIS OF THE RUSSIAN MARKET OF AMMONIUM FLUORIDE, SODIUM FLUORIDE, AND POTASSIUM FLUORIDE
DYNAMICS AND THE STRUCTURE OF THE RUSSIAN MANUFACTURE IN THE YEARS 2018-2020
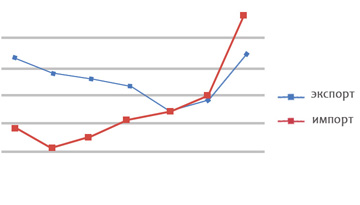
DYNAMICS AND THE STRUCTURE OF THE RUSSIAN IMPORT IN THE YEARS 2018-2020
Total import volume and import dynamics structured by the product type and the aggregate state
Structure of the studied fluorides import broken down by countries and manufacturers
Structure of the studies fluorides import broken down by application and recipients
Structure of import prices of the studied fluorides
DYNAMICS AND THE STRUCTURE OF THE RUSSIAN MARKET IN THE YEARS 2018-2020
THE MAIN CONSUMERS OF AMMONIUM FLUORIDES, SODIUM FLUORIDES, AND POTASSIUM FLUORIDES IN RUSSIA
ANALYSIS OF THE GLOBAL MARKET FOR AMMONIUM FLUORIDE, SODIUM FLUORIDE, AND POTASSIUM FLUORIDE
TOTAL VOLUME AND DYNAMICS OF THE GLOBAL MARKET STRUCTURED BY THE PRODUCT TYPE AND REGIONS
FORECAST FOR THE GLOBAL MARKET FOR THE STUDIED FLUORIDES UNTIL 2030
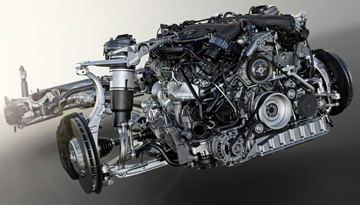
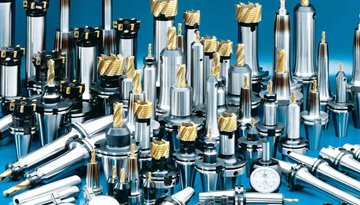
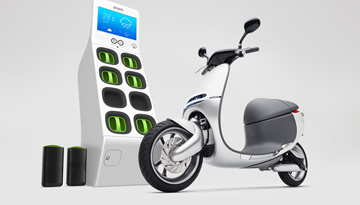
THE MAIN FIELDS OF APPLICATION OF THE STUDIED FLUORIDES IN THE GLOBAL MARKET
THE LARGEST GLOBAL MANUFACTURERS OF THE STUDIED FLUORIDES
DYNAMICS OF WORLD TRADE OF FLUORIDES, THE MAIN EXPORT AND IMPORT COUNTRIES
THE MOST PROMISING COUNTRIES FOR THE SUPPLY OF FLUORIDES FROM RUSSIA
APPENDICES
APPENDIX 1. THE MAIN NET FLUORIDE IMPORTING COUNTRIES BROKEN DOWN BY SUPPLYING COUNTRIES
LIST OF TABLES AND DIAGRAMS
Table 1. Fields of application of the studies fluorides
Table 2. Dynamics and the structure of the Russian manufacture of the studied fluorides broken down by manufacturers and product types, 2018-2020, tons, million rubles
Table 3. Company profile of the Chemical Plant of Fluoride Salts
Table 4. Company profile of the Angarsk Electrochemical Combine
Table 5. Dynamics and the structure of the Russian fluoride import broken down by the product type, 2018-2020, tons, thousand dollars
Table 6. Dynamics and the structure of the Russian import of the studied fluorides broken down by the aggregate state, 2018-2020, tons, thousand dollars
Table 7. Dynamics and the structure of the Russian import of the studied fluorides in the form of solution broken down by the content of the main substance, 2018-2020, tons, thousand dollars
Table 8. Dynamics and the structure of the Russian import of the studied fluorides broken down by the countries of origin and manufacturers, 2018-2020, tons, thousand dollars
Table 9. Dynamics and the structure of the Russian import of the studied fluorides broken down by the manufacturers and the product type, 2018-2020, tons, thousand dollars
Table 10. Dynamics and the structure of the Russian import of the studied fluorides broken down by recipients and the product type, 2018-2020, tons, thousand dollars
Table 11. Dynamics and the structure of the Russian import of the studied fluorides broken down by the product type and the consumption segment, 2018-2020, tons, thousand dollars
Table 12. Dynamics of import prices of the studied fluorides in solid form broken down by the product type and manufacturers, 2018-2020, dollars per ton
Table 13. Dynamics of import prices of the studied fluorides in the form of solution broken down by the product type and manufacturers, 2018-2020, dollars per ton
Table 14. Dynamics and the structure of the Russian market of the studied fluorides broken down by the product type, 2018-2020, tons, million rubles
Table 15. The main trading companies in the Russian fluoride market
Table 16. The identified consumers of the studied fluorides by the main sectors
Table 17. Other end users of the studied fluorides
Table 18. Dynamics and the structure of the global market of the studied fluorides broken down by the product type, 2018-2020, thousand tons, million dollars
Table 19. Parameters used for building forecasts of the global market of the studied fluorides until 2030
Table 20. Fields of application of the studied fluorides in the global market
Table 21. Information about the largest global manufacturers of the fluorides
Table 22. The main fluorides export countries, thousand tons, million dollars, 2016-2020
Table 23. The main fluorides import countries, thousand tons, million dollars, 2016-2020
Table 24. The most promising countries for the fluorides export from Russia
Diagram 1. The structure of the Russian manufacture of the studied fluorides, 2018-2020, tons, % (tons)
Diagram 2. Dynamics and the structure of the Russian import of the studied fluorides, 2018-2020, tons, million dollars
Diagram 3. Share distribution of the Russian import of the studied fluorides broken down by the product type, 2018-2020, % (tons), % (dollars)
Diagram 4. The structure of the Russian import of the studied fluorides broken down by the countries of origin, 2020, % (tons), % (dollars)
Diagram 5. Dynamics of the Russian market of the studied fluorides broken down by the product types, 2018-2020, tons, million rubles
Diagram 6. Share distribution of the Russian market of the studied fluorides broken down by the product types. 2020, % (tons), % (rubles)
Diagram 7. Share of imports on the Russian market of the studied fluorides broken down by the product types, 2020, % (tons), % (rubles)
Diagram 8. Share of exports in the Russian manufacture of the studied fluorides broken down by the product types, 2020, % (tons), % (rubles)
Diagram 9. Structure of the global market of the fluorochemicals broken down by the product type, 2020, thousand tons
Diagram 10. Structure of the global market of the studied fluorides broken down by regions, 2020, thousand tons
Diagram 11. Dynamics and the structure of the global market of the studied fluorides broken down by the product types, 2006-2020, thousand tons
Diagram 12. Forecast for the global market of the studied fluorides broken down by the product type, 2020-2030, thousand tons
Diagram 13. Dynamics of world trade of fluorides, 2016-2020, thousand tons, million dollars
Diagram 14. Structure of world trade of fluorides and average export prices broken down by a few major exporting countries, 2020, % (dollars), % (tons), dollars per ton
Diagram 15. Structure of world trade of fluorides and average import prices broken down by a few major importing countries, 2020, % (dollars), % (tons), dollars per ton
File name: API-2092